NATS Java Client Latency Benchmarking
Scott Fauerbach — June 21, 2021
NATS Java Client Latency Benchmarking
Many users have asked to see how the NATS Java client performs specifically in regard to latency. This blog will discuss using the NatsAutoBench program to run a latency test and how to generate a CSV file that can be used to make a histogram.
The NatsAutoBench can run a variety of tests. This blog will focus only on the latency testing.
Running the Latency Test
You can run the latency test from an IDE or a command line, but you will need to build from the source code.
- Get the source code from
https://github.com/nats-io/nats.java
using
git cloneor downloading the zip. - Build the code. There is a gradle file in the directory. Your IDE should be able to handle this, or you can build from the command line using the
./gradlew clean build -x test - Prepare the correct command line arguments or modify the NatsAutoBench code before you build to have the correct arguments. The code itself has examples on how to do this.
- Run the program from your IDE or command line.
Running from the command line
If for example, the version of the code you have is 2.11.4, the build will create jnats-2.11.4-SNAPSHOT jars. If you are running from the nats.java directory the command will look like this:
java -cp build/libs/jnats-2.11.4-SNAPSHOT.jar:build/libs/jnats-2.11.4-SNAPSHOT-examples.jar io.nats.examples.autobench.NatsAutoBench [serverURL] latency [tiny|small|med|large] [-lcsv <filespec>]
Options
Server URL
If your server is running somewhere other than localhost:4222, you will need to supply this information as the first parameter on the command line.
Latency Instruction
Use the word latency to tell the program to run just the latency test.
Test Size
You can specify the size of the test which determines the number of messages to be run for each payload byte size.
| Instruction | Messages | Payload Bytes |
|---|---|---|
| (none) | 5000 | 0, 8, 32, 256, 512, 1024, 4096, 8192 |
| nano | 5 | 0, 8, 32, 256, 512 |
| tiny | 50 | 0, 8, 32, 256, 512, 1024 |
| small | 250 | 0, 8, 32, 256, 512, 1024 |
| med | 2500 | 0, 8, 32, 256, 512, 1024, 4096, 8192 |
| large | 25000 | 0, 8, 32, 256, 512, 1024, 4096, 8192 |
CSV File
The program run will always output a simple results table:
Latency                 |           nanos              |            |
| payload     |   count |    min |  median  |      max | std dev ms |
| ----------- | ------- | ------ | -------- | -------- | ---------- |
| 0 bytes     |  25,000 |     38 |    68.50 |      396 | +/-   0.44 |
| 8 bytes     |  25,000 |     36 |    62.00 |      402 | +/-   0.42 |
| 32 bytes    |  25,000 |     36 |    55.50 |      434 | +/-   0.38 |
| 256 bytes   |  25,000 |     36 |    60.70 |    2,118 | +/-   0.43 |
| 512 bytes   |  25,000 |     37 |    63.60 |    2,342 | +/-   0.46 |
| 1024 bytes  |  25,000 |     35 |    67.40 |    4,028 | +/-   0.48 |
| 4096 bytes  |  25,000 |     37 |    63.70 |    2,274 | +/-   0.50 |
| 8192 bytes  |  25,000 |     40 |    86.30 |   12,998 | +/-   0.87 |

Final memory usage is 278.09 mb / 287.00 mb / 3.48 gb free/total/max
If you would like to get a CSV file that has a timing row for every single message, you must specify the -lcsv <filespec> flag.
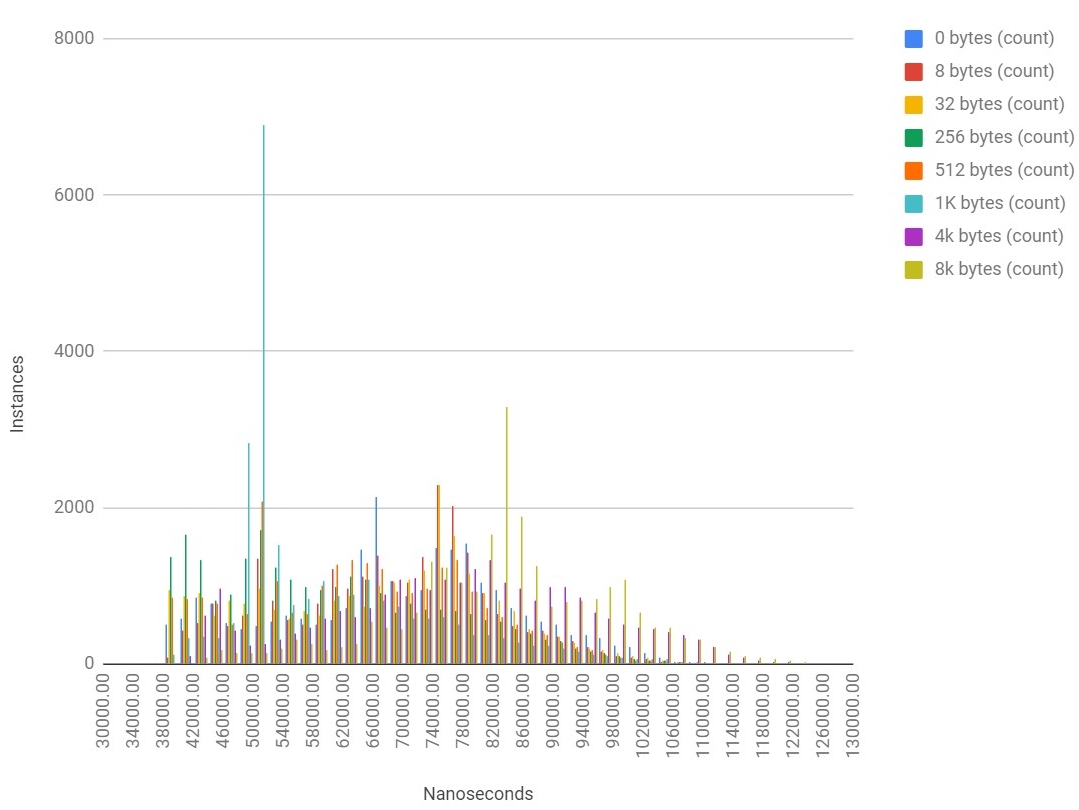
This file can be used to create a histogram.
Example
Run a large latency and output to a file:
java -cp ... NatsAutoBench myhost:4333 latency large -lcsv /home/myuser/nats/latency.csv
Each cell represents a message timing in nanoseconds for the run of the payload byte size in that column. There will be the same number of rows for each payload size.
0 bytes,8 bytes,32 bytes,256 bytes,512 bytes,1024 bytes,4096 bytes,8192 bytes
35800,35500,37800,36500,35700,38300,38500,41100
35800,35700,37900,37100,37600,38400,39000,42700
35900,35900,38300,37200,37700,38600,39200,42700
35900,36000,38300,38500,37700,38600,39300,42700
35900,36000,38500,38600,37800,38700,39600,43100
35900,36100,38800,38700,37900,38700,39700,43200
36000,36100,38800,38700,38000,38700,39700,43300
...
You can use a spreadsheet or other tool to create a histogram:
Test Considerations
Many things will affect performance. Here are just a few things to consider:
- CPU power of machine running the test program and the server.
- Mode of the server. Don’t run the server with
-DVdebugging flag, run it like you would in production. - Physical networking configuration. For true benchmarking, it would be best not to run the test from your laptop over wi-fi connecting to a server in another region. Unless that is your production configuration.
About the Author
Scott Fauerbach is a member of the engineering team at Synadia Communications .
Back to Blog